When I started out doing data I tought myself how to scrape websites. I didn't just do it because it was fun to learn how to scrape; it was my only source of interesting data that I could use to practice my analysis skills. There wasn't as much open data back then, so I had to find them by hand.
Open datasets are important not just for transparancy and insights but also for education. Having a fun dataset is the best way to start learning the joy of analyzing it.
In this document I will describe datasets that I like to use whenever I teach simply because they are fun to analyse. This is a working document as I will mainly use this page for reference, more datasets will be added over time. It will contain both content that I've collected and content from others.
Each dataset has a description, a download link, a suggestion for an analysis and a source. Please be nice and refer to it if you are going to share this data or use it in your research.
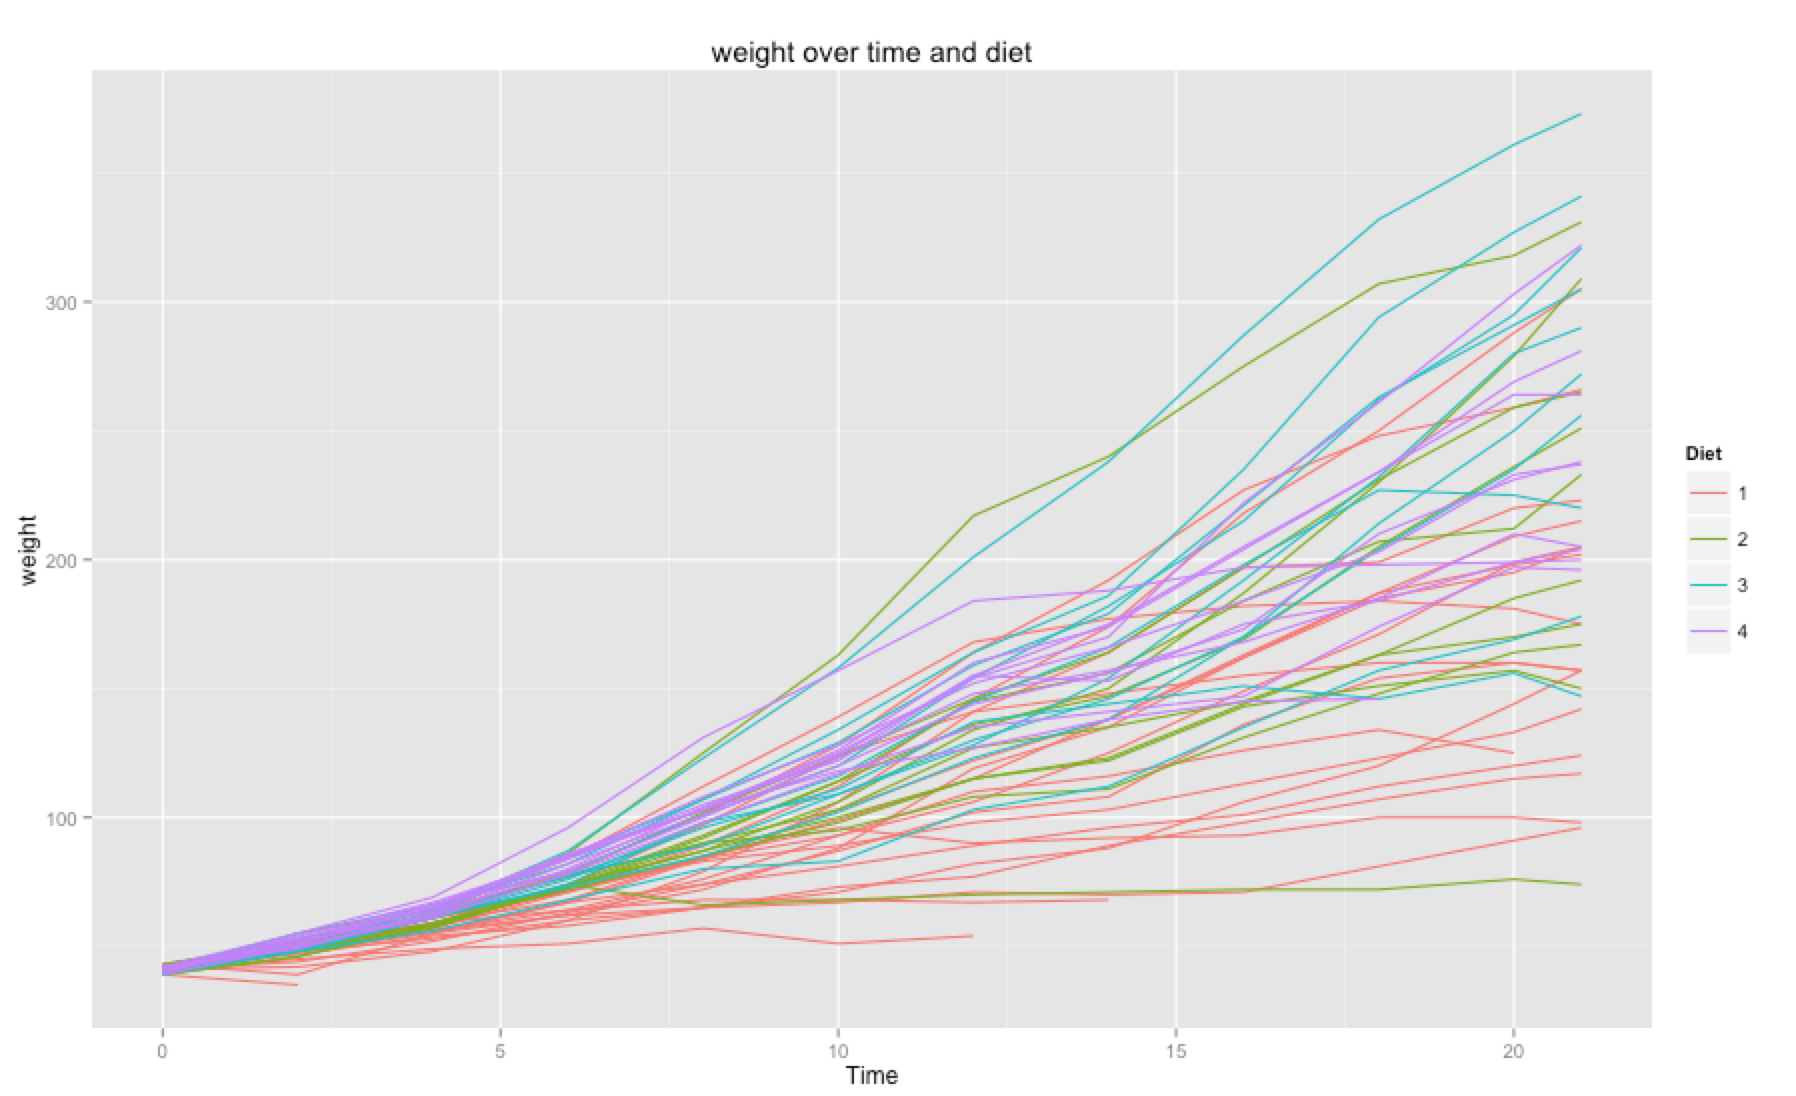
Chick Weight
My absolute favorite starter dataset. In this dataset you try to predict how much a chicken will weight right before it is slaughtered. You get to analyse the effect of different diets on the chickens weight as well as the effect of time.
You can download the data here.
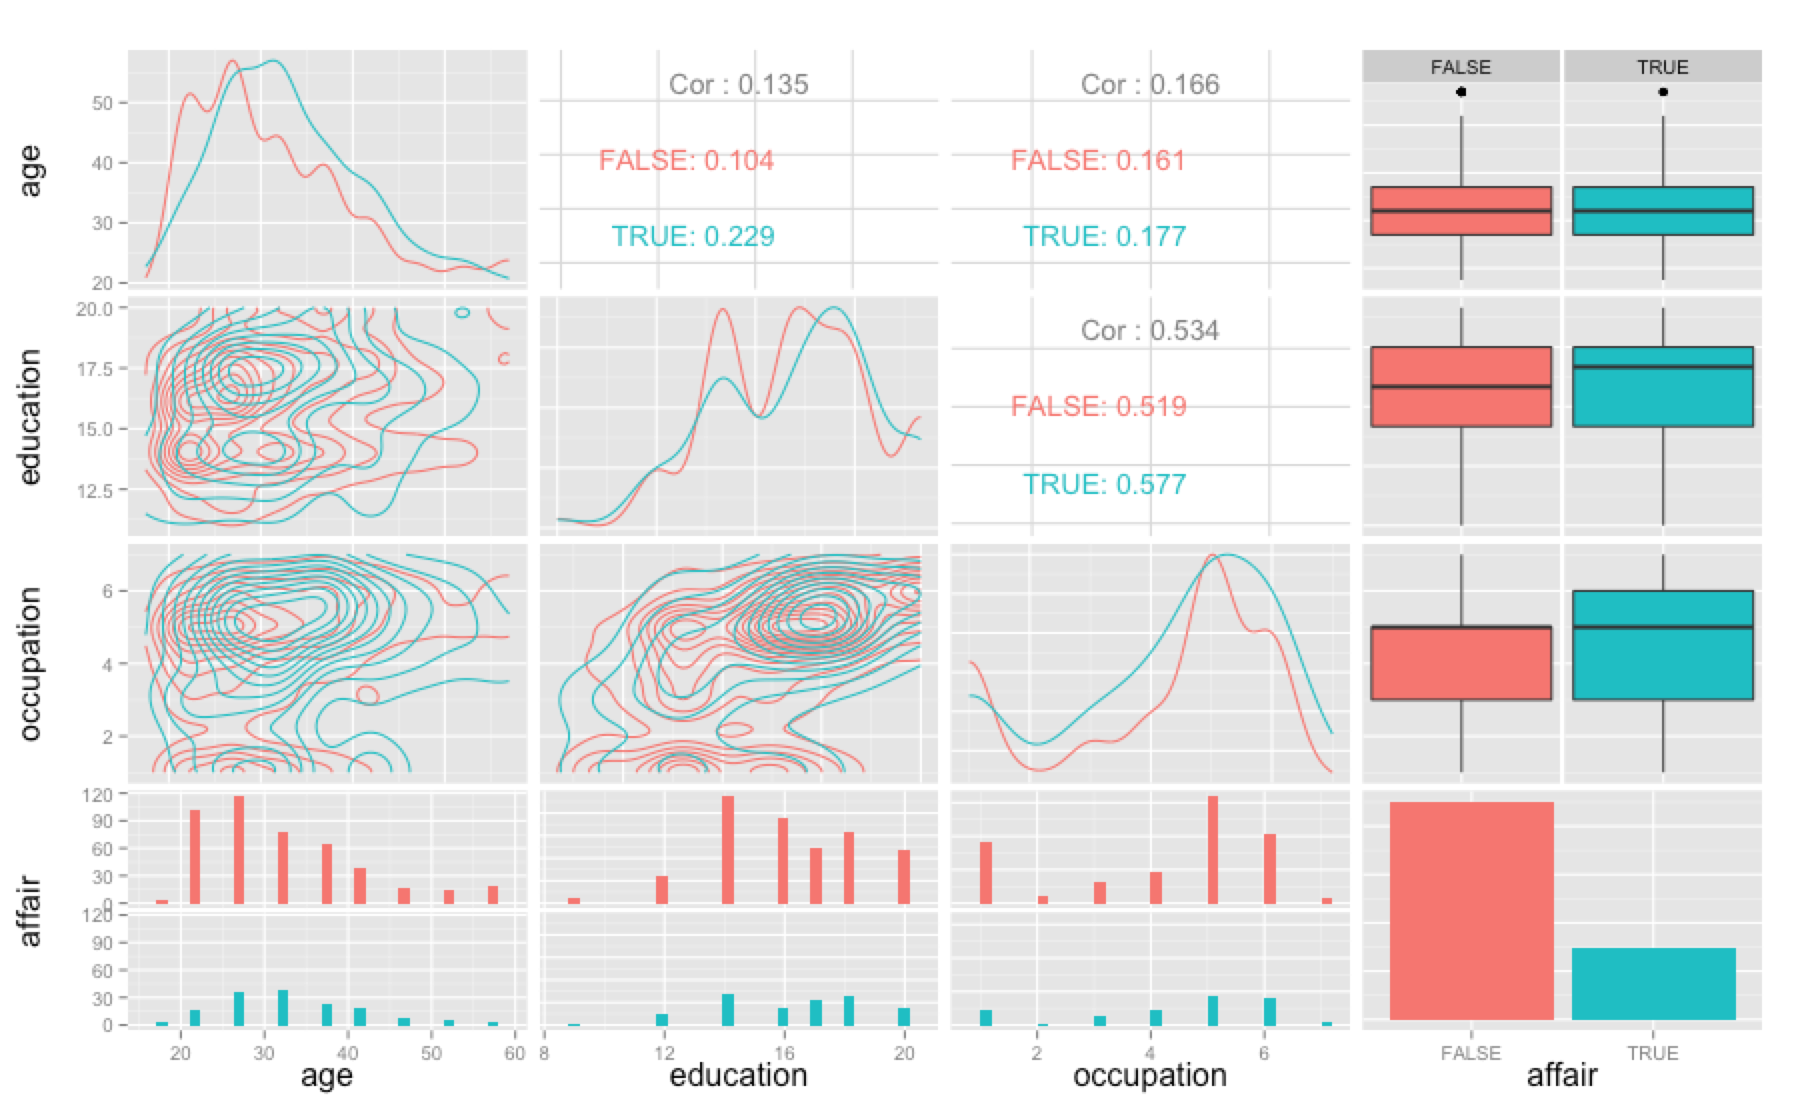
Affairs
This dataset from 1978 contains information about politicians having affairs. The goal of the dataset is to find characteristics that make it more plausable for a politician to have an affair. Does the number of children matter? How religious the politician is? Or education/marriage rating?
You can download the data here.
Source : Fair, R. (1977) “A note on the computation of the tobit estimator”, Econometrica, 45, 1723-1727. http://fairmodel.econ.yale.edu/rayfair/pdf/1978A200.PDF.
Computers
This dataset contains data from 1993 to 1995 about the prices of computers. Because it was the 90ies you can check what the effect of the addition of cd-rom drive is on the price of the computer, or the effect of the clock speed on the price. You could even check the effect of ad placements.
lm(formula = price ~ speed + hd + ram + screen, data = Computers)

Residuals:
     Min       1Q   Median       3Q      Max
-1048.21  -297.09   -48.29   214.30  2538.47

Coefficients:
             Estimate Std. Error t value Pr(>|t|)
(Intercept)  10.33311   88.22222   0.117    0.907
speed         5.24930    0.27836  18.858   <2e-16 ***
hd           -0.57936    0.03507 -16.520   <2e-16 ***
ram          76.74545    1.53586  49.969   <2e-16 ***
screen      105.52592    6.18879  17.051   <2e-16 ***
---
Signif. codes:  0 ‘***’ 0.001 ‘**’ 0.01 ‘*’ 0.05 ‘.’ 0.1 ‘ ’ 1

Residual standard error: 427.5 on 6254 degrees of freedom
Multiple R-squared:  0.4586,    Adjusted R-squared:  0.4583
F-statistic:  1325 on 4 and 6254 DF,  p-value: < 2.2e-16
You can download the data here.
Source: Stengos, T. and E. Zacharias (2005) “Intertemporal pricing and price discrimination : a semiparametric hedonic analysis of the personal computer market”, Journal of Applied Econometrics, forthcoming
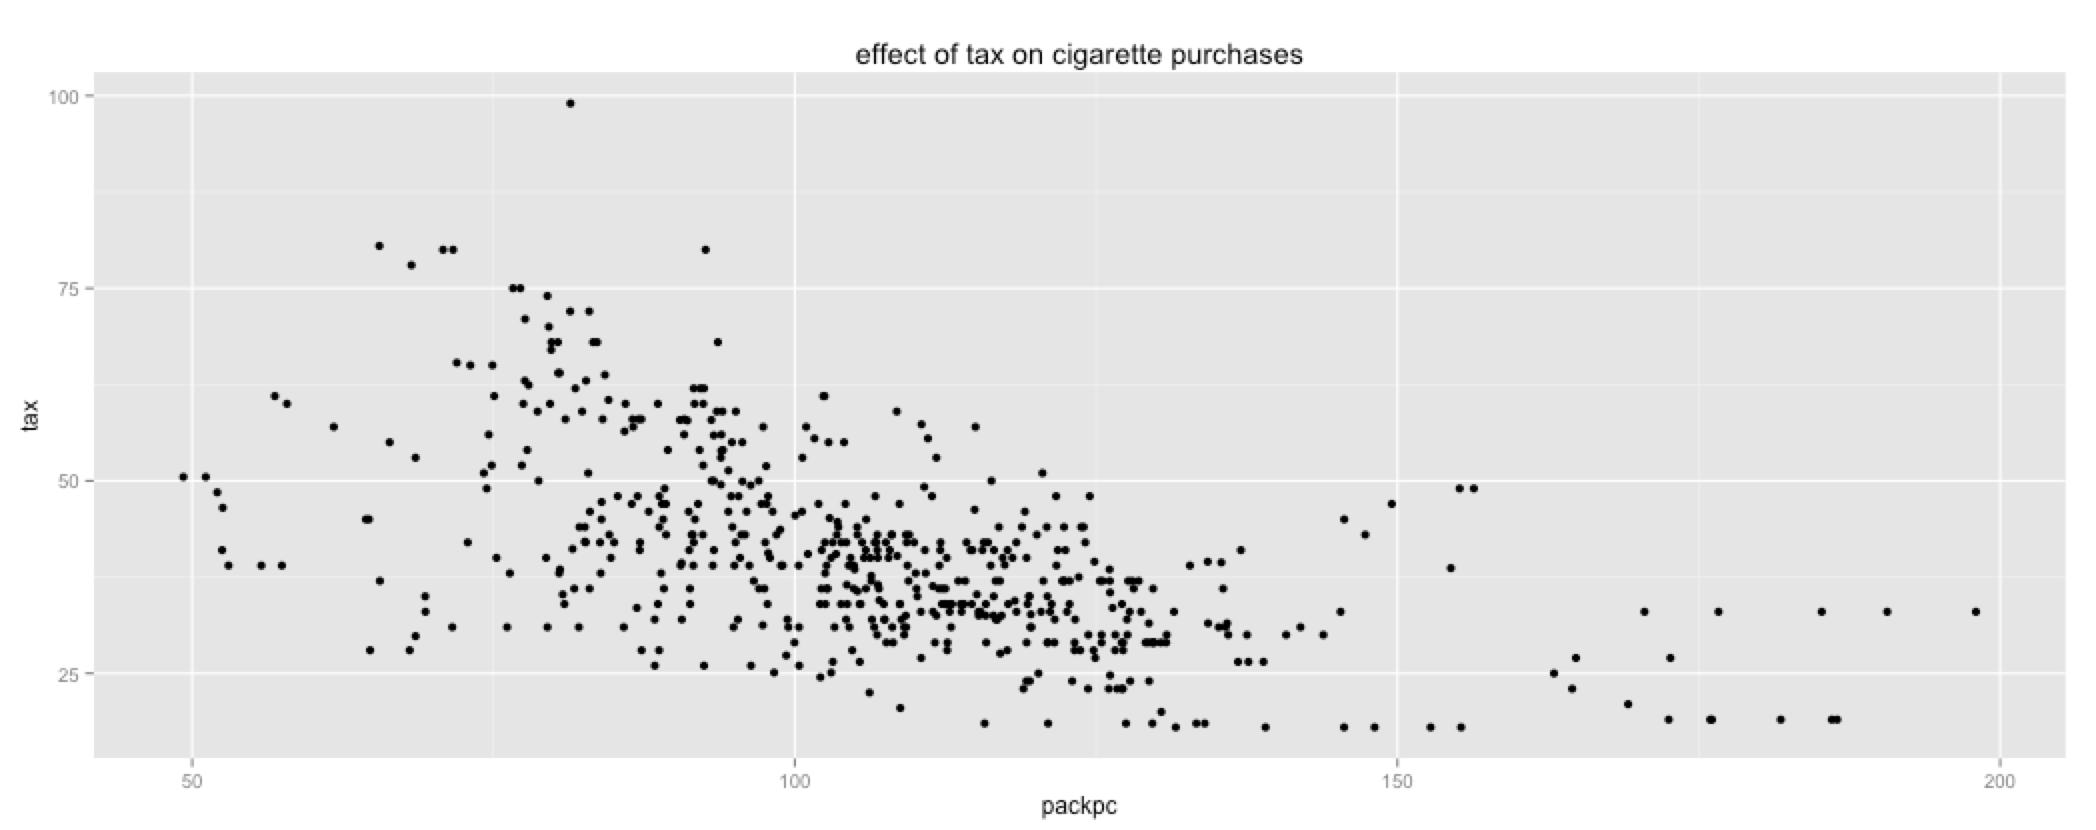
Cigarettes
This dataset contains data about cigaret consumption in the united states. I have a hunch that certain states might have more smokers than others and it may also be that the price elasticity of these smokes is not consistent across states.
The dataset contains state, year, consummer price index, state population, number of packs per capita, state personal income (total, nominal), average combined local tax, average price and excise tax including sales tax.
You can download the data here.
Source:Stock, James H. and Mark W. Watson (2003) Introduction to Econometrics, Addison-Wesley Educational Publishers, http://wps.aw.com/aw_stockwatsn_economtrcs_1, chapter 10.
Stocks
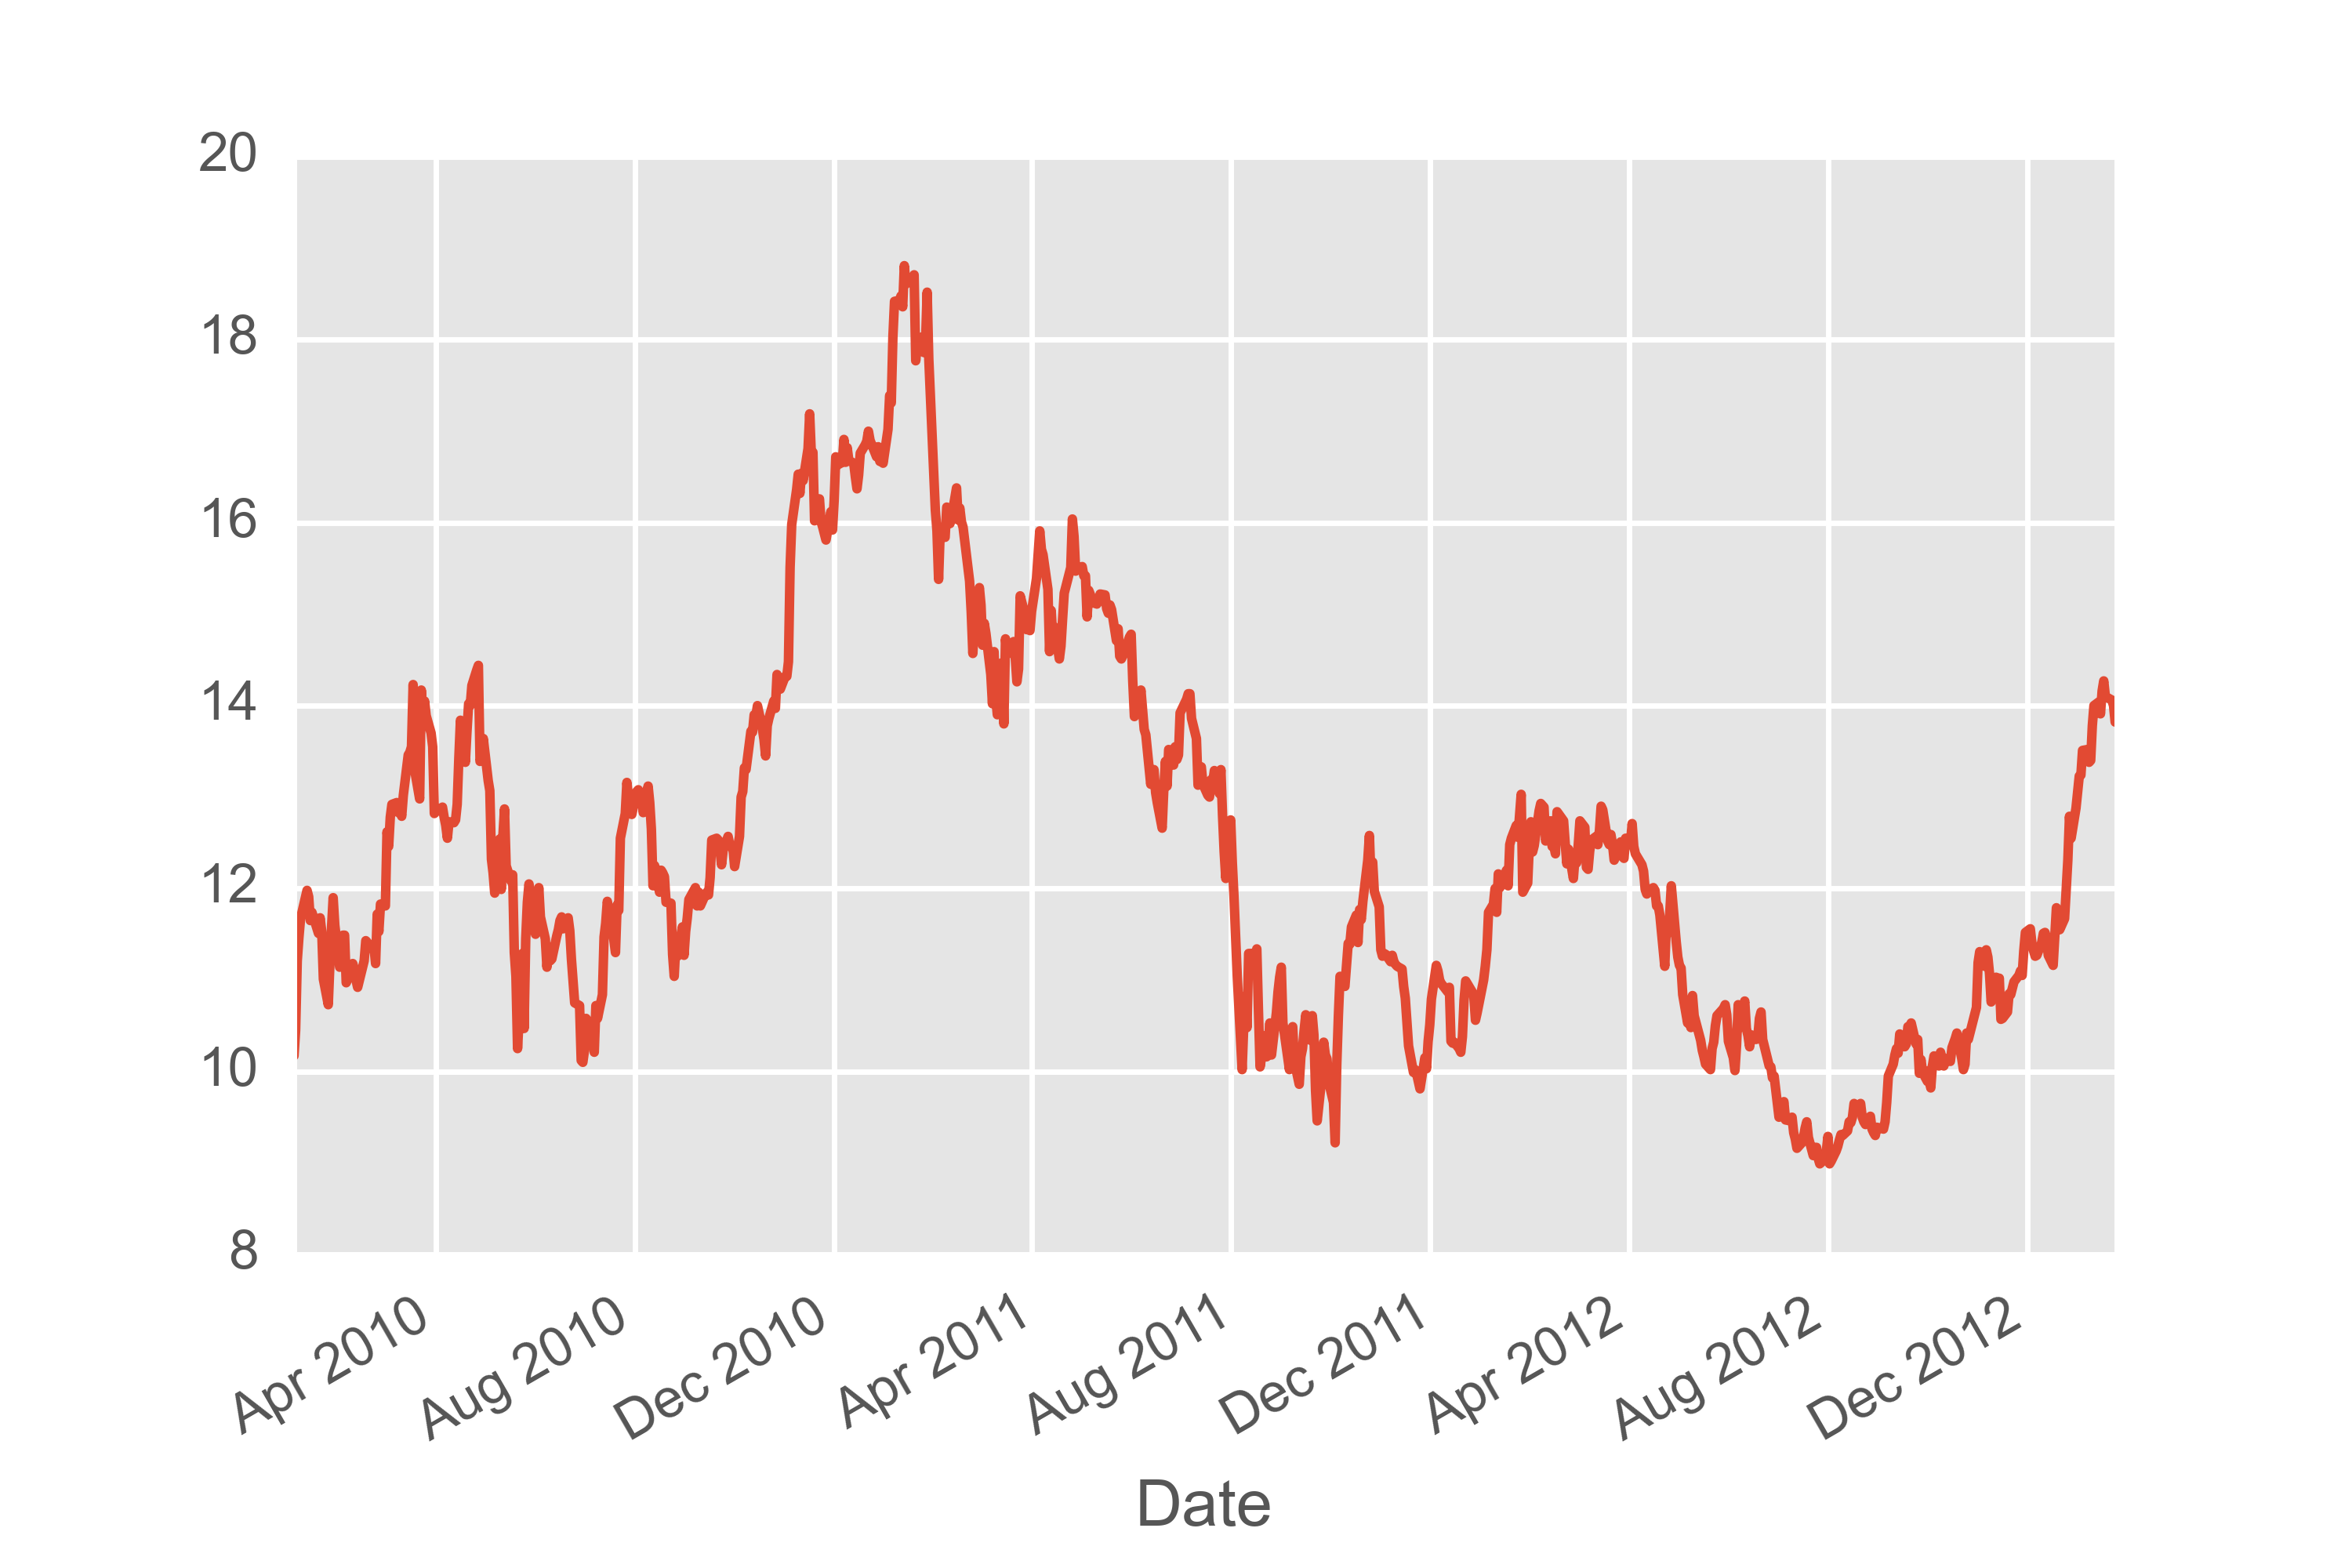
Stocks are always fun to analyse and as always, pandas is your best friend.
> import pandas.io.data as web
> import datetime
> start = datetime.datetime(2010, 1, 1)
> end = datetime.datetime(2013, 1, 27)
> f = web.DataReader("F", 'yahoo', start, end)
This will give you a dataset which you can then analyze.
> print(f.head())
             Open   High    Low  Close     Volume  Adj Close
Date
2010-01-04  10.17  10.28  10.05  10.28   60855800    9.42672
2010-01-05  10.45  11.24  10.40  10.96  215620200   10.05028
2010-01-06  11.21  11.46  11.13  11.37  200070600   10.42625
2010-01-07  11.46  11.69  11.32  11.66  130201700   10.69218
2010-01-08  11.67  11.74  11.46  11.69  130463000   10.71969
Or even quickly visualize.
> f['Open'].plot()
Pokemon
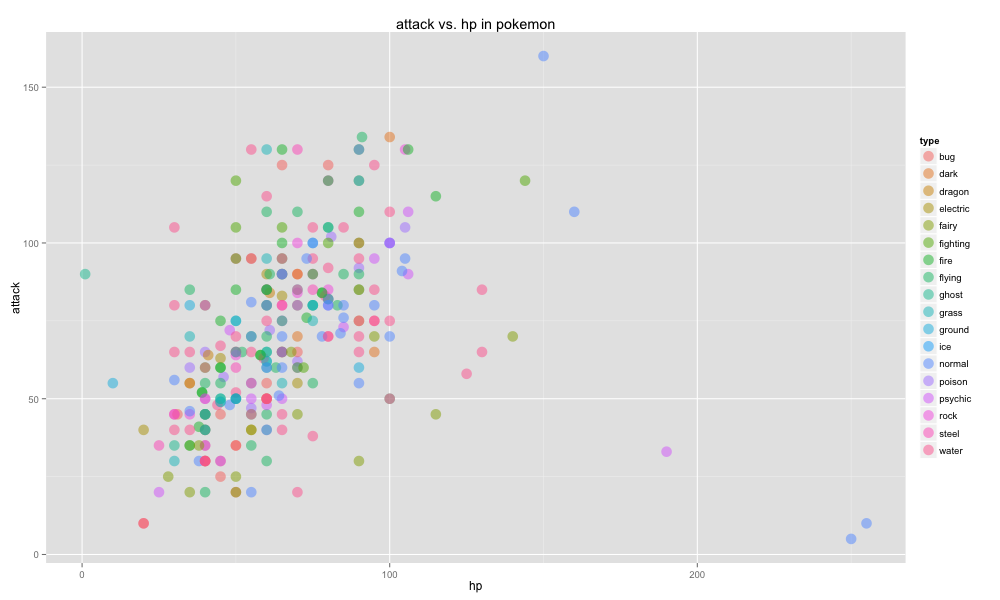
Even though most fans are nearing their 30ies, pokemon is still an obsession. Which is why the internet created a reliable pokemon api along with a python package that you can use to download pokemon data.
import pykemon
import pandas as pd
pokemons = []
for i in range(1,300):
    pokemons.append(pykemon.get(pokemon_id=i))

data = [[p.name, p.hp, p.attack, p.types.keys()[0]] for p in pokemons]
df = pd.DataFrame(data, columns=["name","hp","attack","type"])
You might be able to create a model that can predict what pokemon beats another pokemon, or perhaps you would like to analyze the hp/attack ratio for each pokemon ... the possibilities are endless.
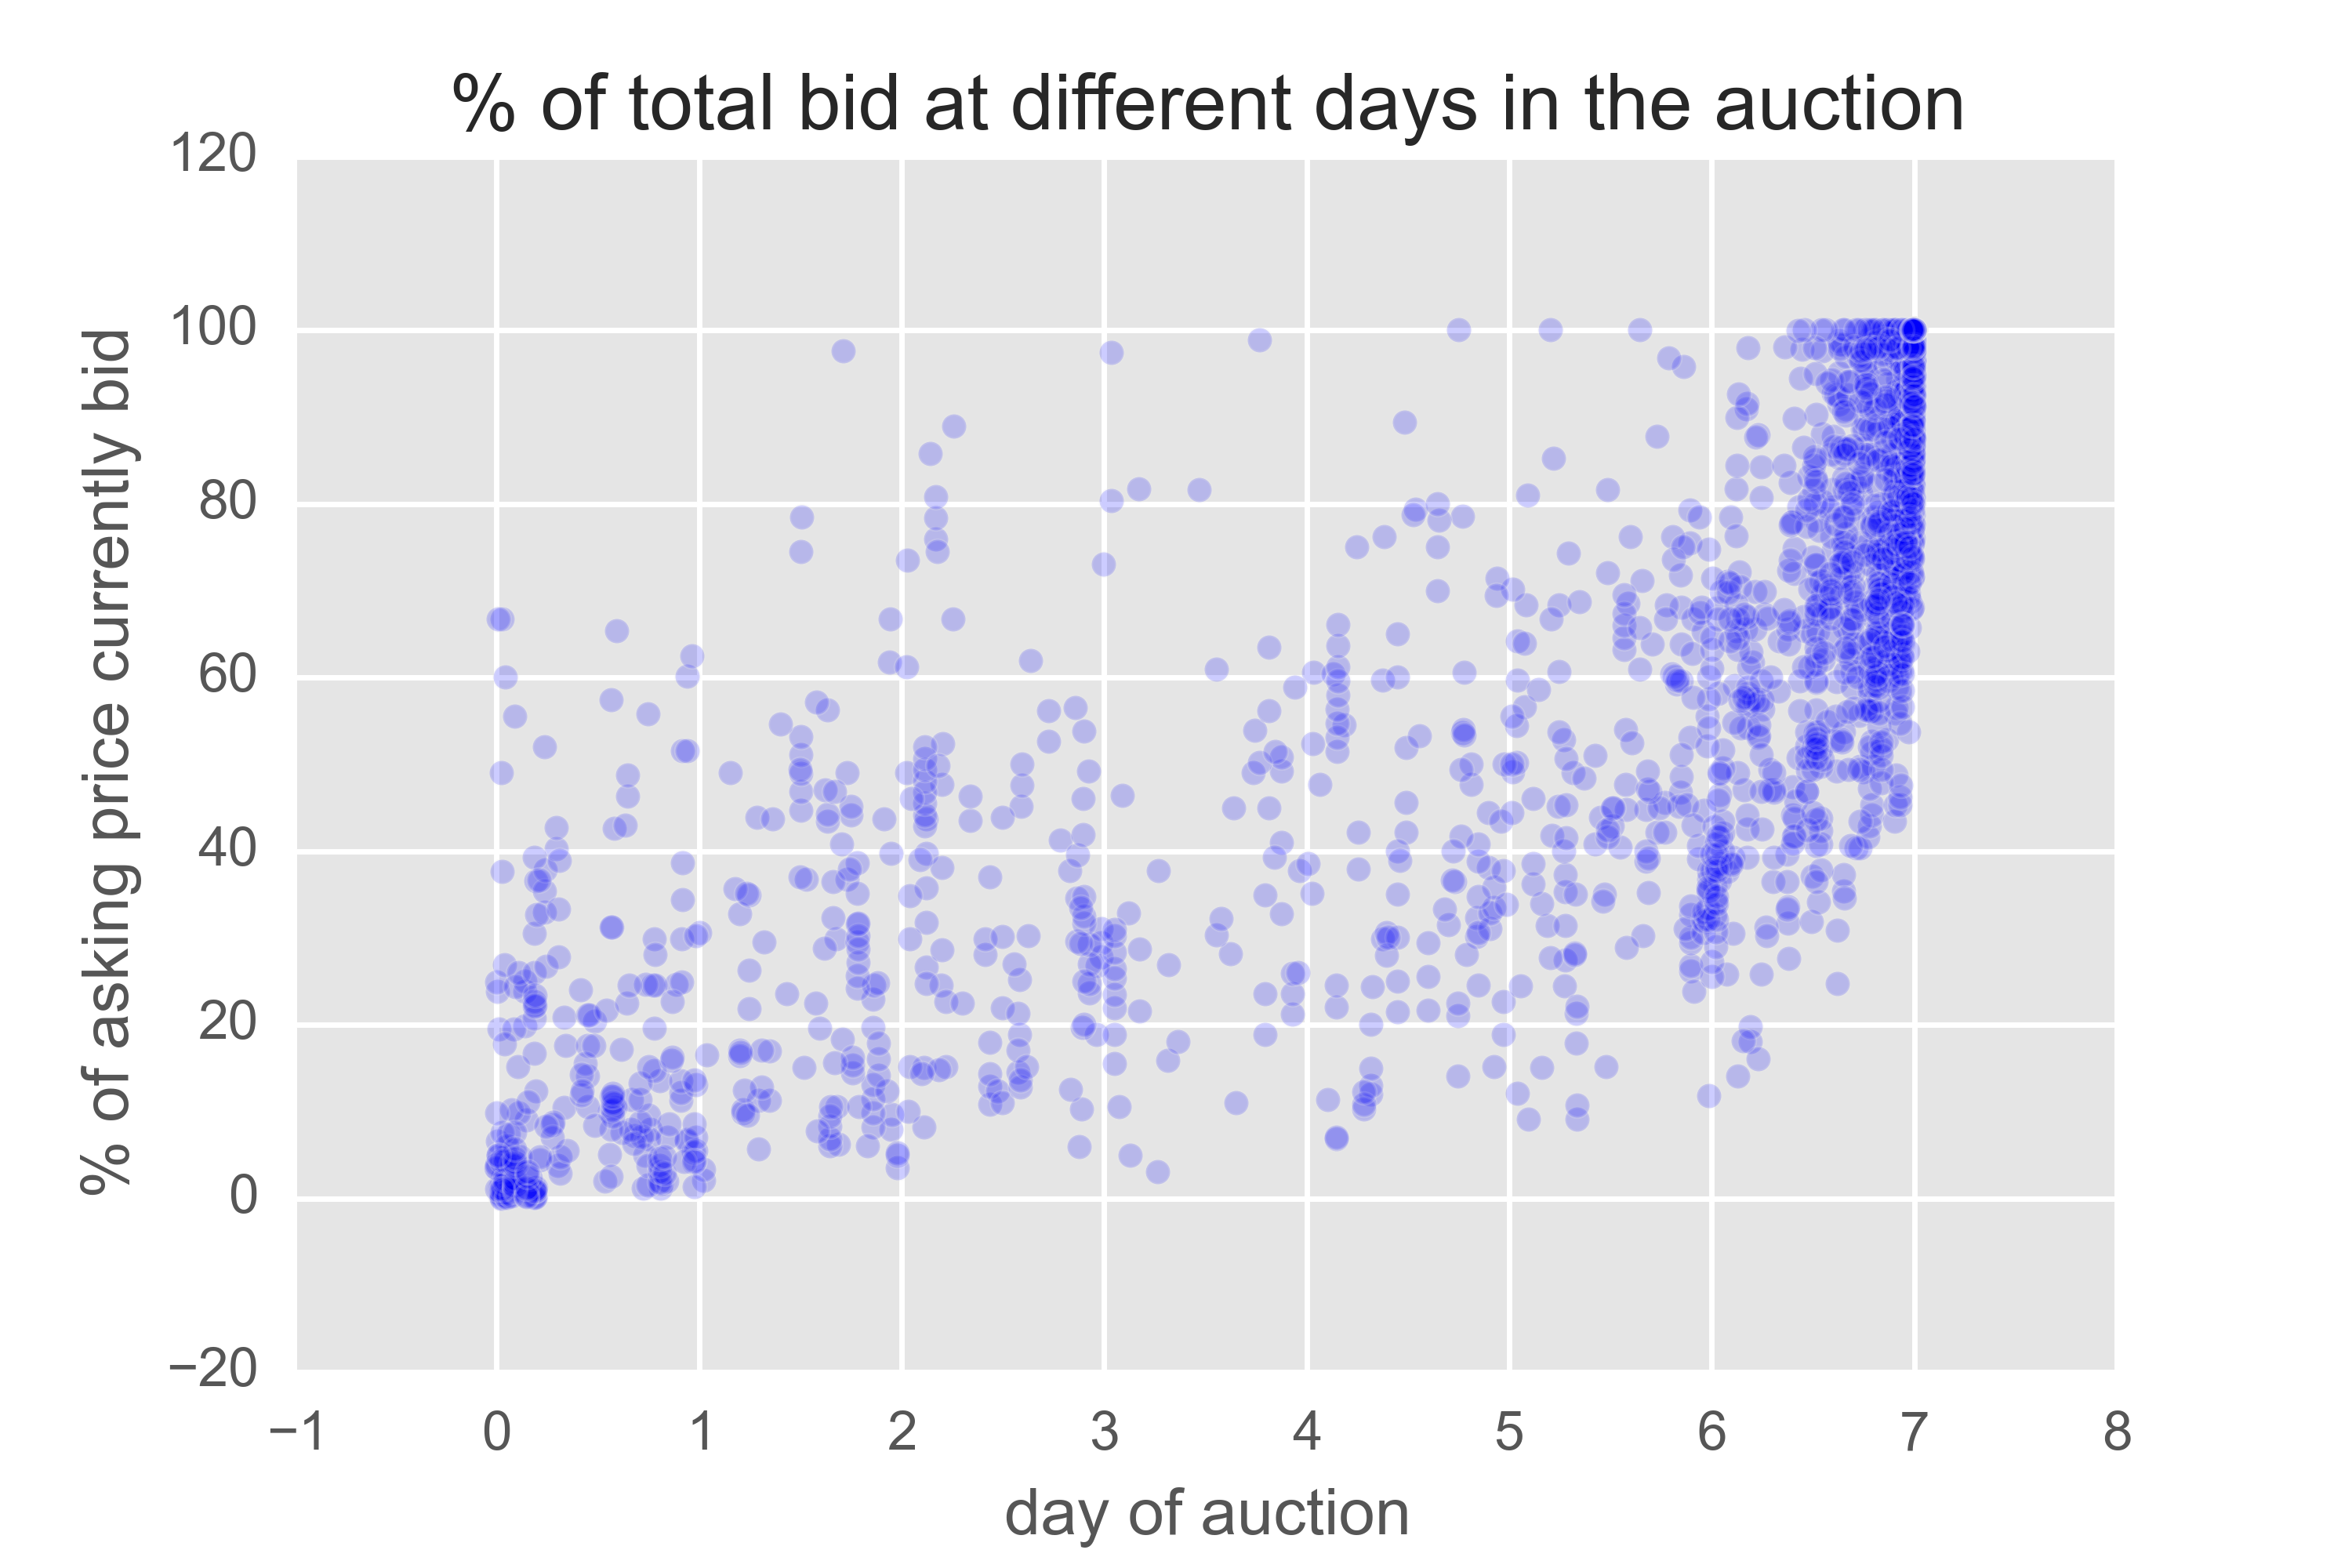
Xbox at eBay
Auctions are interesting from a game theory/behavioral science perspective which is why ebay decided to share some data a while ago. This dataset contains bidding information on (amoungst other things) Xbox sales. You can find the data here.
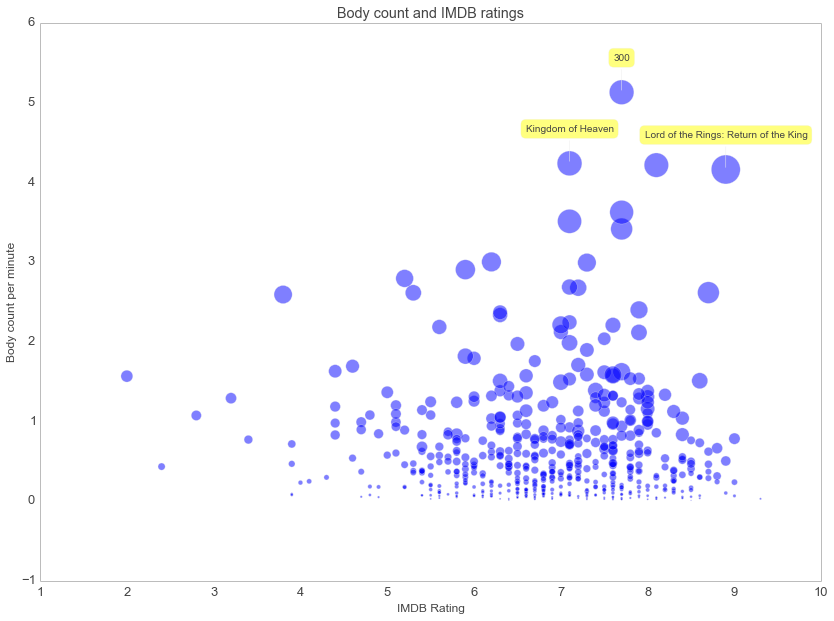
Deaths in movies
Ever wonder how many people died in that action movie? Yep, there's a dataset for that too. Thanks to the fine folks at moviebodycount. For inspiration on how to analyze this dataset I refer you to an exellect notebook by Ramiro Gomez.
A small preview of this notebook; turns out that there is a relationship between movie deaths and IMDB rating.
Github
Github has a pretty great api that you could mine from the command line. It you have curl, jq and csvkit you can turn any github repo into csv data with just two lines of command line.
curl https://api.github.com/users/mbostock/repos | jq '.' > github.json
in2csv github.json > github.csv
Conclusion
This list is far from complete but these datasets should help students to get motivated to learn about data analysis.
Feel free to use any of these datasets to teach! Please, do keep the sources in mind. Others have spent a lot of time on them.
{% endfilter %}