This document contains a startup script for H2O in R. It is a silly example (why would anybody want to train a deep encoder on the iris dataset) but it helps people get started. This setup is meant for local use, not for cluster setup.
Just copy the code in!
Setup
library(readr)
library(dplyr)
library(ggplot2)
library(GGally)
library(h2o)

h2o.init(ip = 'localhost', port = 54321, nthreads= -1, max_mem_size = '4g')
h2o.clusterInfo()
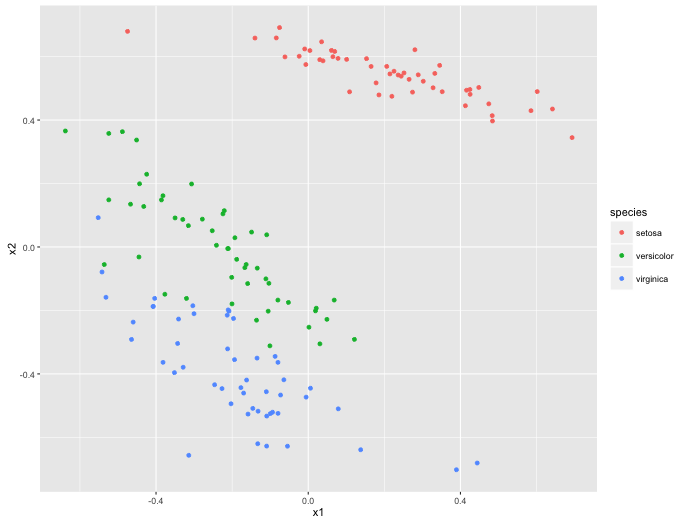
Autoencoder
h2o_df <- as.h2o(iris)

mod_nn <- h2o.deeplearning(
  x = c('Sepal.Length', 'Sepal.Width', 'Petal.Length', 'Petal.Width'),
  training_frame = h2o_df,
  hidden = c(2),
  epochs = 100,
  activation = 'Tanh',
  autoencoder = TRUE
)

features <- h2o.deepfeatures(mod_nn, h2o_df, layer=1)
pltr_nn <- features %>%
  as.data.frame %>%
  mutate(species = iris$Species)

colnames(pltr_nn) <- c("x1", "x2", "species")

ggplot() +
  geom_point(data=pltr_nn, aes(x1, x2, colour = species))
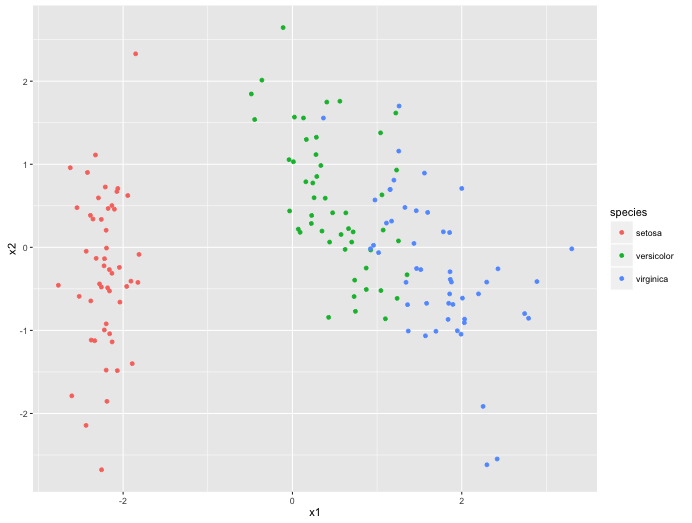
PCA
mod_pca <- h2o.prcomp(
  x = c('Sepal.Length', 'Sepal.Width', 'Petal.Length', 'Petal.Width'),
  training_frame = h2o_df, k = 2, transform = 'STANDARDIZE'
)

pltr_pca <- h2o.predict(mod_pca, h2o_df, num_pc=2) %>%
  as.data.frame %>%
  mutate(species = iris$Species)

colnames(pltr_pca) <- c("x1", "x2", "species")

ggplot() +
  geom_point(data=pltr_pca, aes(x1, x2, colour = species))
The syntax is very lovely R-like. One just has to remember that h2o assumes a slightly different internal datastructure to keep things performant (similarly to SparkR). It does offer some machine learning possiblilities not available to SparkR users. Features!
You should also be able to find this blog on: r-bloggers