In R you can use the double arrow assignment (<<-) operator to keep track of state between functions and its parent functions. You can use this operator in shiny to create even more interactivity because it allows you to keep track of state in an app. I have made a minimum viable shiny app to show this pattern.
ui.R
library(shiny)

shinyUI(fluidPage(

  # Application title
  titlePanel("Shiny App"),

  # Sidebar with a slider input for number of bins
  sidebarLayout(
    sidebarPanel(
      sliderInput("ntree",
                  "give the number of trees:",
                  min = 1,
                  max = 200,
                  value = 10, step=1)
    ),

    # Show a plot of the generated distribution
    mainPanel(
      textOutput("runs"),
      plotOutput("perf")
    )
  )
))
server.R
library(shiny)
library(ggplot2)
library(reshape2)
library(randomForest)
df <- ChickWeight
n <- nrow(df)
perfdf <- data.frame(ntree = as.numeric(),
mse_train = as.numeric(),
mse_test = as.numeric())
count = 0
shinyServer(function(input, output) {
output$runs <- renderText({
train <- df[sample(n),][1:478,]
test <- df[sample(n),][479:n,]
rf <- randomForest(weight ~ Time + Diet, data = train, ntree = input$ntree)
train$mse <- (predict(rf, train) - train$weight)^2
test$mse <- (predict(rf, test) - test$weight)^2
row <- data.frame( ntree = input$ntree,
mse_train = mean(train$mse),
mse_test=mean(test$mse))
perfdf <<- rbind(perfdf, row)
count <<- count + 1
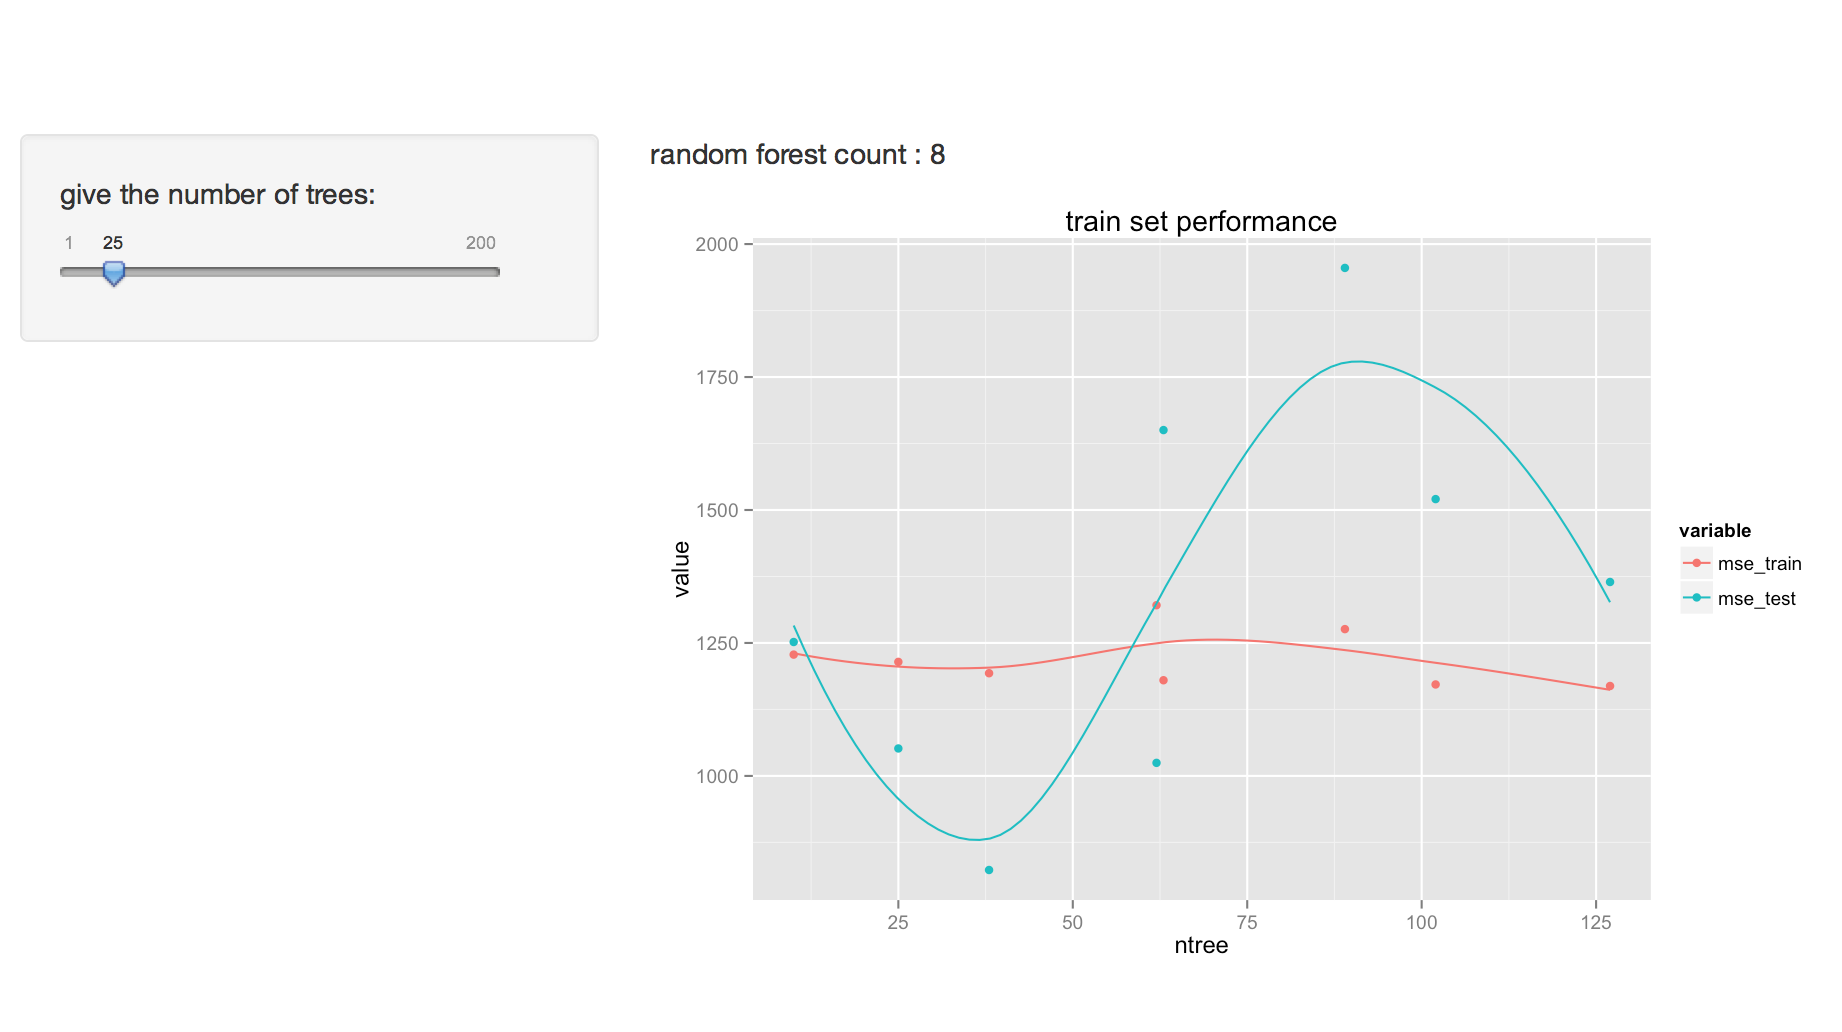
paste("random forest count :", count)
})
output$perf <- renderPlot({
input$ntree
perfdf <- melt(perfdf, id.vars = c("ntree"),
variable.name = "variable", value.name = "value"
)
p <- ggplot() + geom_point(data=perfdf, aes(ntree, value, colour=variable))
p <- p + stat_smooth(data=perfdf, aes(ntree, value, colour=variable), se = FALSE)
p + ggtitle("train set performance")
}, height=400)
})
This app runs a random forest regression task on a small dataset. It splits the data into training and test set and you as a user will be able to specify how many trees the random forest needs to use. We keep track of the performance of the training and test set for each time the user specifies the number of trees. In other words, we are keeping track of state as the user supplies the shiny app with input.
The output
To understand how this works, notice these two lines specifically:
perfdf <<- rbind(perfdf, row)
count <<- count + 1
The app will fail if we use <- instead of <<-. Why? Because the variables that we are trying to update (the variables that keep track of the count and random forest performance) are outside of scope otherwise. By using this pattern, we can keep state of what the user is giving the dashboard as input. You might even consider logging the users behavior this way.
Running this locally
If you want to run this code immediately, just run the following command in Rstudio (make sure that you have shiny installed):
shiny::runGist("https://gist.github.com/koaning/1b7b52e03ba5d81d5966")
{% endblock body %}